Exploring RTT Logging on STM32
November 19, 2024
Why Do We Need RTT Logging?
-
No Additional Pins Required Adding a UART connection requires determining the correct TX pin for the target device, which can take time. Since SWD is already connected during code debugging, it's convenient to use it for retrieving logs as well.
-
Faster Communication with SWD SWD communication operates in the Mbps range, whereas UART is typically configured to 115200 bps. While UART can sometimes be set to Mbps speeds, these are non-standard and may cause unexpected issues.
-
Non-Intrusive Logging RTT is non-intrusive, whereas UART requires corresponding logic in the firmware. For logging purposes, synchronous UART transmission can block the MCU due to its speed limitations, impacting performance. While asynchronous UART is an option, it involves more complex logic. In contrast, RTT relies on the MCU writing to memory, which is much more efficient and reliable.
Preliminary Methods Explored
The primary approach is based on Segger RTT, using tools like JLink Viewer to retrieve data. The clearest explanations can be found in this video and this article.
However, I find it challenging to fully understand these more "professional" methods through textual explanations. It feels like exploring the code and figuring it out myself might be more effective.
Principles of RTT
First, we need to understand the principles behind RTT.
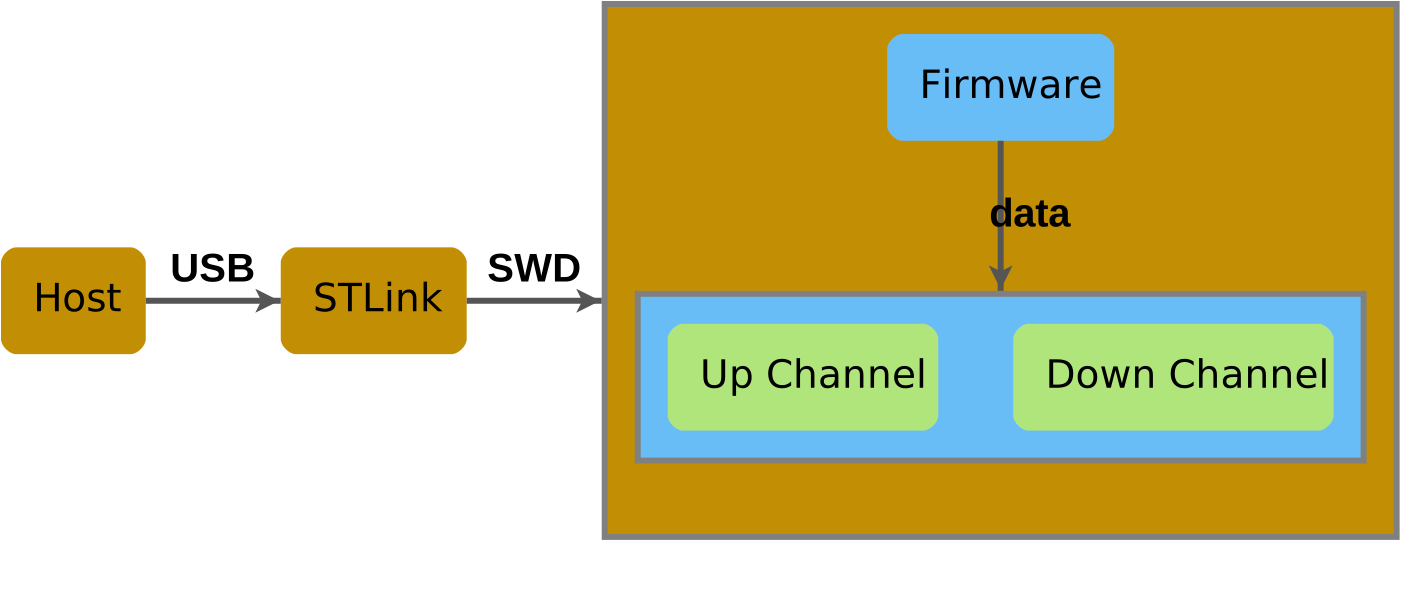
Diagram: RTT Protocol, showing up-channel and down-channel communication between host and STM32 via SWD.
The RTT protocol includes both up-channel and down-channel. This means that input from devices like the host keyboard can be transmitted to the STM32 via SWD. However, this is not our current focus. We are primarily concerned with logging, which utilizes the up-channel.
In this context, STM32 firmware can write data to the STM32's memory. Similarly, the host can read the corresponding memory content via SWD. For the up-channel buffer, the RTT protocol requires prior knowledge of the metadata's storage address. Using the metadata, particularly wrOff and rdOff, it is possible to determine the current state of the printf ring buffer. The data structure used by Segger RTT is as follows (note that rdOff is declared as volatile. Why is this?):
typedef struct {
  const     char*    sName;         // Optional name. Standard names so far are: "Terminal", "SysView", "J-Scope_t4i4"
            char*    pBuffer;       // Pointer to start of buffer
            unsigned SizeOfBuffer;  // Buffer size in bytes. Note that one byte is lost, as this implementation does not fill up the buffer in order to avoid the problem of being unable to distinguish between full and empty.
            unsigned WrOff;         // Position of next item to be written by either target.
  volatile  unsigned RdOff;         // Position of next item to be read by host. Must be volatile since it may be modified by host.
            unsigned Flags;         // Contains configuration flags
} SEGGER_RTT_BUFFER_UP;
Based on this definition, when the STM32 firmware is running, it continuously writes data to the up-buffer and updates wrOff. Meanwhile, the host continuously reads data from this buffer via SWD and updates rdOff. This creates a simple and functional ring buffer mechanism, allowing logs to be output.
Memory Access Conflicts and Performance Issues
Since rdOff is only written by the host after its initial value is set, and wrOff as well as the buffer data are always written by the firmware, there are no resource contention issues.
But how does the host access the target's memory? My understanding may not be entirely comprehensive, but I believe the SWD protocol specifies that the host can directly access target resources through SWD. In particular, memory access does not go through the MCU; instead, it likely uses buses like AHB/APB to directly read the memory. As for potential bus contention, this should be a concern for the chip's design, not something we need to worry about.
This structure also answers the question of how this method performs. Since it does not occupy the MCU, its impact on the MCU's performance is virtually zero.
Practice
Writing to the RTT Buffer in Firmware
Relevant commit: GitHub Commit
The corresponding code looks like this:
  SEGGER_RTT_printf(0, "hello world\n");
  int count = 0;
  while (1)
  {
    count++;
    SEGGER_RTT_printf(0, "in %d\n", count);
    HAL_GPIO_TogglePin(LED_GPIO_Port, LED_Pin);
    HAL_Delay(500);
  }
The SEGGER_RTT_printf() function performs detailed boundary checks for each character written. However, it's worth noting that printf itself consumes a significant amount of MCU computational resources, its usage should be considered carefully.
Try to read RTT buffer on the host directly
Initially, I removed printf() from the loop and then tried extracting data using the following commands:
st-flash read memory_dump.bin 0x2001FF58 64
xxd memory_dump.bin
Make sure to install stlink-tools first:
sudo apt-get install stlink-toolsWhen the firmware is running, you can easily see the hello world text in the retrieved data. This worked without any issues. At this point, I began to wonder: Do we really need a complex tool like J-Link Viewer to view this data? If a simple st-flash read can retrieve the data, then based on the principles discussed earlier, any SWD-based tool should be able to do something similar.
Use probe-rs to continuously read the buffer
Since I'm most familiar with probe-rs, I looked into it and found the rtthost command. After compiling it, I gave it a try, and it worked perfectly:
./target/debug/rtthost -c STM32F411CEUxI didn't change my wiring setup at all, so the process overall was very straightforward. While the initial setup took some time, the actual execution went smoothly. It was truly an enjoyable experience!
As for the chips supported by rtthost, you can obtain the full list of MCUs supported by the probe-rs suite of tools using the following command:
probe-rs chip listFrom the output, locate the specific MCU you are using.
Notes
Remember that when running rtthost, the ST-Link will be occupied, and other programs like OpenOCD used for flashing firmware will become unavailable. In this experiment, I manually switched between them. If you plan to use this setup frequently, you could write a script to manage openocd and rtthost together.
Additionally, since I compiled rtthost from source for this experiment, you might consider creating a binary version and placing it in your tools path if you intend to use it regularly.
Summary
RTT Logging offers a fast, non-intrusive, and pin-free solution for debugging embedded systems using the SWD interface. Unlike UART logging, RTT ensures minimal performance impact on the MCU while providing high-speed communication. By utilizing tools like st-flash or probe-rs, retrieving logs from the RTT buffer becomes simple and efficient. This streamlined approach eliminates the need for complex setups like J-Link Viewer, making it a practical choice for developers. Whether for debugging or performance monitoring, RTT Logging is an effective and modern alternative to traditional methods.